Data Drift: How to Effectively Monitor Your AI Models in Production
Learn to detect data drift, understand its impacts, and set up robust monitoring for your models in production.
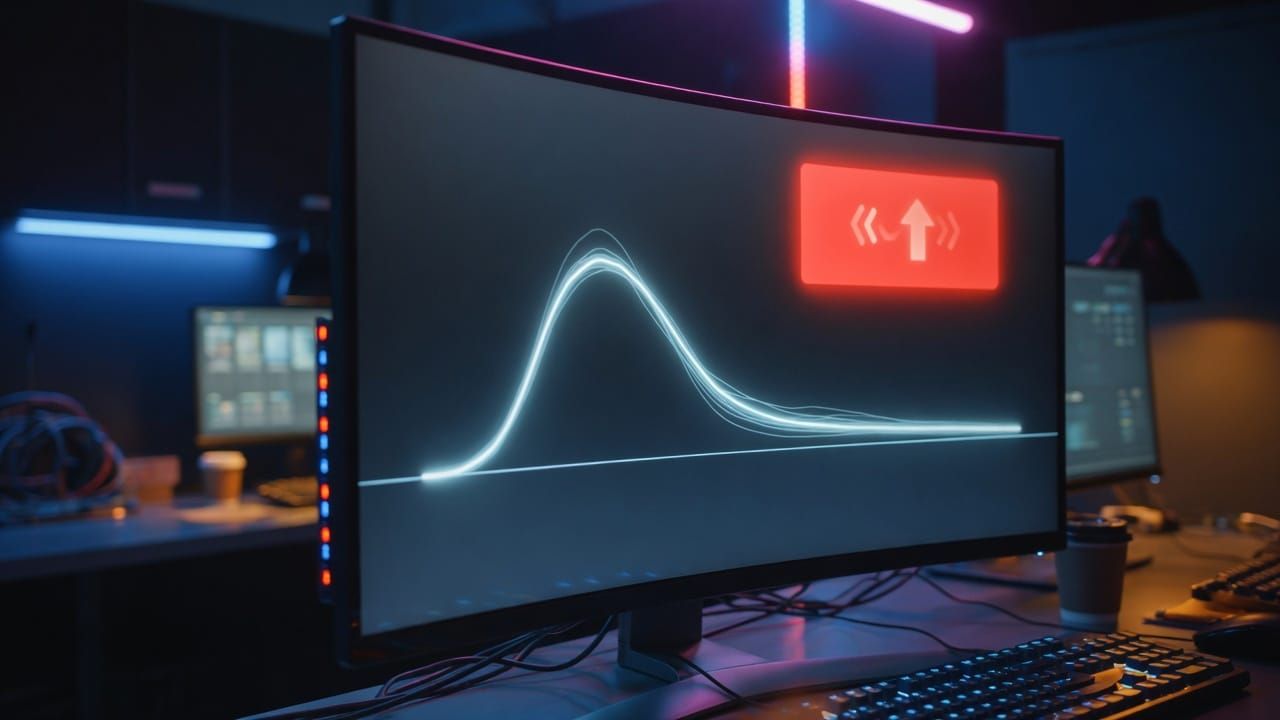
Imagine a real estate price prediction model that worked perfectly at launch. Six months later, errors start accumulating. Why? The data has changed: new neighborhoods, sudden inflation, modified buying habits. This phenomenon is called data drift. In this article, we’ll explore what it means, why it’s crucial to monitor it, and how to set up effective monitoring, even as a beginner or intermediate in AI.
What is data drift?
Data drift, or data drift, refers to the change in the distribution of input data between the training phase and the production phase. Unlike a classic bug, the model continues to run, but its predictions become progressively less reliable. A concrete example: a bank fraud detection model trained on 2022 transactions may miss new fraud techniques that appeared in 2024.
The main types of drift
Generally, three forms of data drift are distinguished:
- Covariate drift: the characteristics of the data change (e.g.: the average age of customers increases).
- Concept drift: the relationship between the variables and the target evolves (e.g.: a purchasing behavior that is no longer correlated in the same way).
- Label drift: the very definition of what we are trying to predict changes over time.
These drifts can appear alone or combine, making detection more complex.
Why Monitoring is Essential in Production
An unmonitored model can cause financial losses, a poor user experience, or even discriminatory decisions. Consider the example of a movie recommendation system: if users’ tastes shift toward shorter content (series vs. feature films), the model will continue suggesting long movies and lose relevance. Without monitoring, these degradations often go unnoticed until business metrics drop sharply.
How to Detect Data Drift
The detection relies on statistical comparisons between the training data and the new data. Tests such as the Kolmogorov-Smirnov test are used for continuous variables or the χ² test for categorical variables. A simple approach involves regularly calculating the feature distributions and alerting as soon as a significant deviation appears.
Tools and Best Practices for Monitoring
Several open-source libraries make this task easier. Evidently AI or NannyML can generate visual reports on drifts. A recommended practice is to define alert thresholds and automate weekly or daily checks depending on the volume of data. It is also useful to retain a representative sample of the training data for future comparisons.
# Simple example of detection with pandas
import pandas as pd
from scipy.stats import ks_2samp

def detect_drift(ref_data, new_data, column, threshold=0.05):
    stat, p_value = ks_2samp(ref_data[column], new_data[column])
    return p_value < threshold
Conclusion
Data drift is not an exception; it’s the rule in production. By implementing proactive monitoring with suitable tools and clear alerts, you protect the value of your models and build . Start small: choose one or two critical features, track their distribution, and iterate. The robustness of your AI systems depends directly on this.
💬 Have a question or want to go further? Join the community on Discord: https://discord.gg/GwhUKccQcM